Telescopic View of the Air Pollution Control Galaxy
Air Pollution Control is a $100 billion galaxy in the $1 trillion AWE Universe. Will it grow to $170 billion per year in a decade or fall short? The answer is best determined by analyzing the synchronized motion of one hundred 1 billion-dollar/yr. stars, one thousand 100 million-dollar/yr. planets and 10,000 moons. All of which move in unison.
The moons combine various aggregations among one hundred countries, thirty product types, and thousands of operators in forty industries. OEMs can follow the lead of distributors and use the intelligence from the process equipment suppliers to plan the space travel.
Here is a telescopic view of the air pollution control industry to serve as a starting point.
It can be argued that the most active stars are those dealing with CO2 absorption followed by liquefaction and sequestration. The importance is magnified by the need to remove all the air pollutants from the CO2 prior to liquefaction.
30 years ago, CO2 suddenly became an air pollutant. It is now viewed in a manner similar to SO2 or NOx. SO2 is captured in absorbers. Most use a limestone slurry and produce gypsum. A minority makes sulfuric acid. Some sulfur becomes calcium sulfate waste and is stored in landfills.
Similar processes are now being employed to remove CO2 from stack gases. Absorbers concentrate the CO2 which is then liquefied and delivered back to the underground reservoirs from which it originated.
Major air pollution system companies such as MHI and B&W have applied their absorber knowledge to capture CO2.
The liquids and powders capital equipment for air pollution control is just as significant as the equipment to treat gases. Pollutants are transferred from the air to liquids which must then be purified. Powders are added to react with gases and are also part of the waste stream.
The 2034 air pollution market is subject to major variables and could range from $130 billion to $170 billion by 2034.
The power sector is the largest market followed by oil and gas.
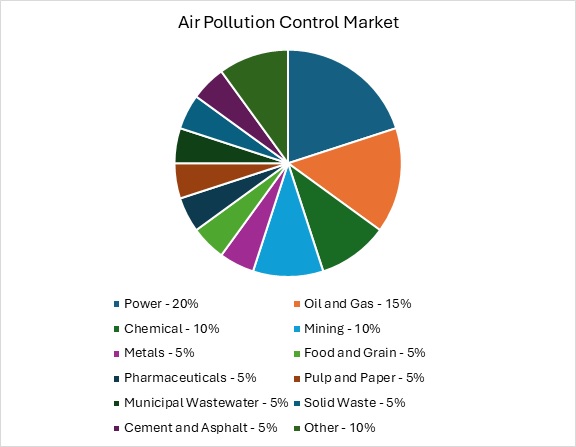
Many light industries from textiles to printing are included in the other category.
Market by Pollutant Type
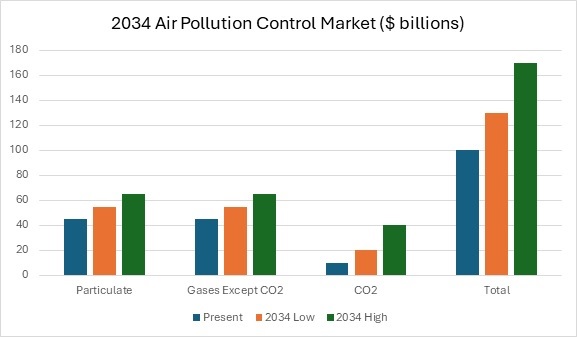
If the current forecasts for CO2 capture are met the market will show healthy growth.
Air pollution control and CO2 capture are intertwined A big air pollution control investment is needed to clean the CO2 prior to liquefaction.
Suppliers of products to treat gases, liquids and powders can be guided by the interdependency of products.
- The end user and his A/E set the production goals and design accordingly.
- System suppliers receive the first orders to provide solutions to meet production and environmental goals.
- The second set of orders goes to process equipment suppliers.
- Based on process needs the pumps, valves, compressors, and fans are then ordered.
- Lastly, orders for consumables are placed.
There is a synchronization of all these moons. A supplier needs to be informed about all of them. A new CO2 absorber can cost effectively capture 99% of the CO2. This changes the Market by substantially for many components.
Technology
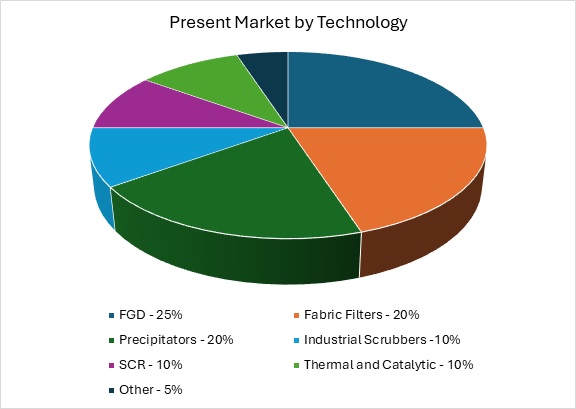
Flue gas desulfurization (FGD) is the most utilized technology. The fabric filter technology is taking away market share from precipitators. Selective catalytic reduction is now applied in most power plants and large combustion sources.
Industrial scrubbers include chemical absorbers.
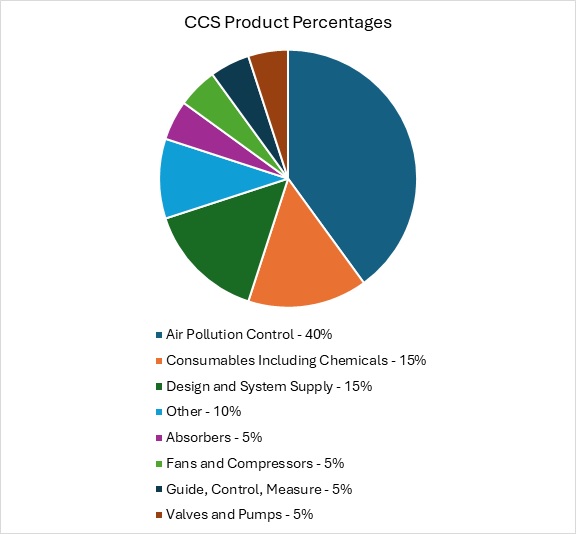
Purchased Items
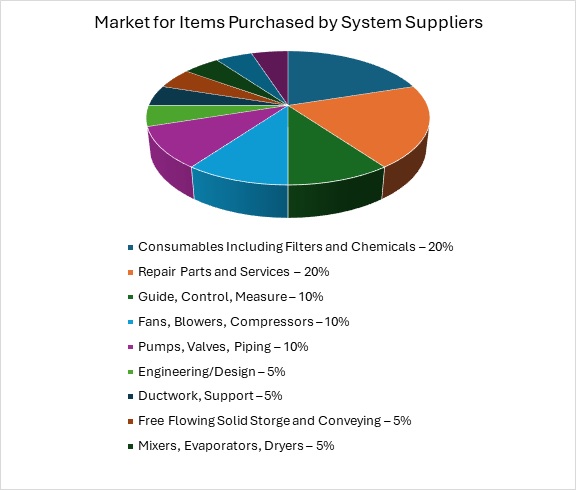
Many scrubber and precipitator suppliers purchase most of the components in their systems.
The air pollution control product mix includes lots of fans, blowers, and compressors. Many of the vessels are too large to be shipped as complete units. Therefore, on-site construction is needed. Ductwork accounts for up to 5% of the total.
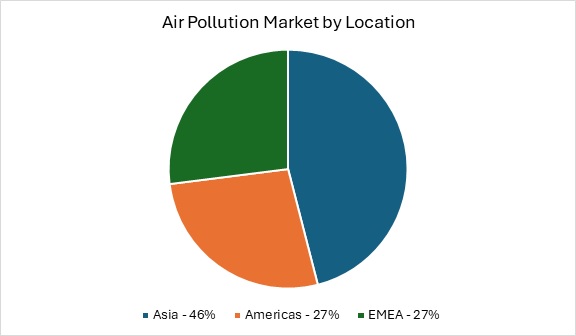
Location
Asia is both the largest and fastest growing market.
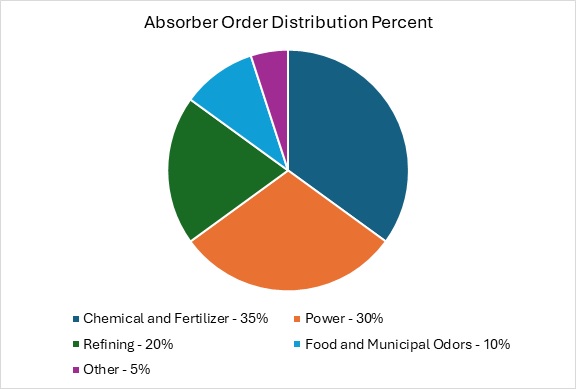
Absorbers
Power presently accounts for 30% of the absorber purchases. But this could rise to 70% if CO2 capture plans materialize.
Vessels with spray nozzles and mist eliminators are used for a wide range of pollutants from SO2 to odors. Sizes can range from less than one foot in diameter for lift station odors to more than one hundred feet in diameter for a large limestone absorber in a power plant.
Multiple absorbers are often employed. For CO2 recovery, the initial absorber removes acid gases and then the downstream absorber captures the CO2. Where particulate fouling is not a concern the absorber is equipped with mass transfer elements such as packing.
Slurry absorbers are used in coal fired power, mining, waste incineration, pulp and paper, sewage sludge incineration, refining, and various chemical processes.
The pumps and valves are frequently lined to provide corrosion and abrasion resistance.
Absorbers used for mass transfer in chemical processes are a unique application where transfer efficiency is paramount.
Odor control scrubbers are needed in sewage and food applications.
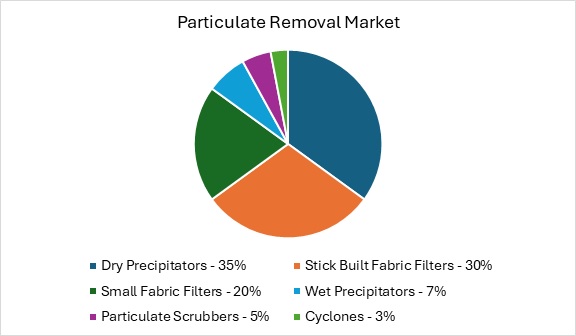
Particulate
In the 1970s most hot gas particulate was removed by precipitators or scrubbers. Over the years that has changed. Stick built fabric filters with as many as 10,000 bags are common. The scrubber share has plummeted in direct proportion to the increase in required efficiency.
Particulate scrubbers:
Fans developing pressure drop as high as 30 inches (e.g. Create sufficient turbulence in a scrubber to remove small particles). Venturi scrubbers are used in conjunction with kilns and furnaces.
Fabric Filters
Glass or polymeric media is used to filter particles in applications ranging from cement kilns to power plant exhaust. There are two sets of suppliers. One set such as Donaldson and Nederman make small units which can be shipped already assembled. Anoth4er set of suppliers makes the large4 units which are assembled on site and classified as stick built.
Andritz and Longking are large unit suppliers.
Bags are replaced every year or two and generate $ billions of revenues. Parker Hannifin and BWF Envirotec are major bag suppliers.
Dry Electrostatic Precipitator
Most coal fired power plants around the world utilize dry electrostatic precipitators for fly ash capture. China operates nearly half of these precipitators and continues to add more capacity. Growth in Asia more than offsets closures in Europe and the U.S.
Longking is one of several major suppliers based in China. B&W is one of the remaining U.S. suppliers. Andritz is active in Europe.
Wet Precipitators
When sticky dusts are encountered, wet precipitators are often applied. Oriented strand board manufacturing is an example. They also are used for acid mist. In the U.S. and China there are systems where stage 1 is a dry precipitator, state 2 is a scrubber, and stage 3 is a wet precipitator.
SCR
NOx emitted by power plants, refineries, and various combustors is reduced with selective catalytic reduction. Plate or honeycomb catalyst is located in the hot gas stream and preceded by ammonia injection.
The refinery industry uses ozone injection ahead of the scrubber to convert the NOx to soluble NO2.
Catalysts typically must be replaced or chemically rejuvenated every two years. Precipitator and FGD suppliers are most frequently the SCR suppliers.
Thermal and Catalytic Oxidation
There are a number of applications where VOCs or other noxious gases can be oxidized through combustion or use of catalysts. Regenerative thermal oxidation entails heat recovery and reuse. This requires additional investments in vessels and dampers. Applications range from automobile painting to plastics manufacture.
Durr based in Germany is a leading supplier. Johnson Matthey is a major catalyst producer.
Air Pollution Continuous Monitoring
Environmental agencies in the U.S. Europe, China, Japan and many other countries require continuous reporting of priority pollutants from each major plant. Companies such as Thermo Fisher supply a wide range of instruments to measure particulate and gases.
Due to this extensive monitoring, it is possible to expand to remote O*M services. One successful example has been dry scrubber operation in some Eastern U.S. power plants.
Carbon Capture and Sequestration
This market could range from $10 billion/yr. to $40 billion/yr. in 2034. CCS figures in two of the three CO2 mitigation approaches.
- Carbon avoidance
- Carbon neutrality
- Carbon removable
Carbon avoidance involves technologies such as wind and solar. The economics of wind vary with space cost, wind conditions, and distance to market. The same is true for solar.
Carbon neutral technologies such as CCS are a good choice when wind and solar are relatively expensive.
Green hydrogen cost varies with renewable electric cost and distance to market. Transporting hydrogen is verry expensive. Blue hydrogen with CCS is gaining traction.
Carbon negative technologies using biomass (BECCS) are likely to be a big winner.
Many countries have joined the United Nations coalition to achieve Net zero by 2050. The goal is to emit no more CO2 than will be absorbed by vegetation and seas. The challenge is that many sources of CO2 are almost impossible to eliminate. Therefore, there is growing support to capture and sequester CO2. If the source is biomass, then the technology becomes carbon negative.
In the UK the 4000 MW Drax power plant now burns wood pellets. CO2 capture systems have been installed and a pipeline to the North Sea is being completed.
There has recently been a major development. MHI and others have developed carbon absorption systems which can cost effectively capture 99% of the CO2 up from 90% previously.
Around 40 CO2 capture commercial facilities are in operation. Since January 2022, project developers have announced ambitions for around 50 new capture facilities to be operating by 2030, capturing around 125 Mt CO2 per year.
CCS requires much cleaner gas than is allowed in stack discharges. So, 40 percent of the CCS investment will be in additional air pollution control equipment.
Longer term CCS could greatly boost the air pollution market. Every coal fired plant which switches to wood pellets and CCS will take as much CO2 out of the air as once was emitted. The more dire the climate change forecasts the greater the potential for CCS.
Moving Forward
For decades McIlvaine has produced market reports on each major air pollution control technology. Each has tens of thousands of forecasts (1). But the reports are just the starting point. If you sell severe service valves your priorities may be scrubbers for FGD, fertilizer, and catalytic crackers. You need a detailed focus on these applications.
We provide the equivalent of the James Web Space Telescope to give you the initial data to start planning your space travel.
Leveraging the Entire Universe of Process Equipment in Your Market Strategy
The challenge is to put the equivalent of the space telescope on your CRM system with specific travel coordinates to help individual s\salesmen. There are 7 steps in the program.
- The telescopic overview
- Ranking of moons based on ROI and ease of pursuit.
- First trip planning
- Report delivery and approval by management.
- Integration of needed data in CRM
- Success Evaluation
- Using increased revenues to sequentially fund the balance of the program.
More information on the program is available from Stacy Hall This email address is being protected from spambots. You need JavaScript enabled to view it.
Bob Mcilvaine can answer questions and can be reached at 847-226-2391 This email address is being protected from spambots. You need JavaScript enabled to view it.
(1) Multi Client Air Pollution Control Reports
N007 Thermal Catalytic World Air Pollution Markets
N008 Scrubber/Adsorber/Biofilter World Markets
N018 Electrostatic Precipitator World Market
N021 World Fabric Filter and Element Market
N027 FGD Market and Strategies
N056 Mercury Air Reduction Market
N031 Industrial IOT and Remote O&M
(including instrumentation and automation)