NEWS RELEASE May 2023
686,000 Cleanroom Filter Forecasts Plus the Facts and Factors to Create Them
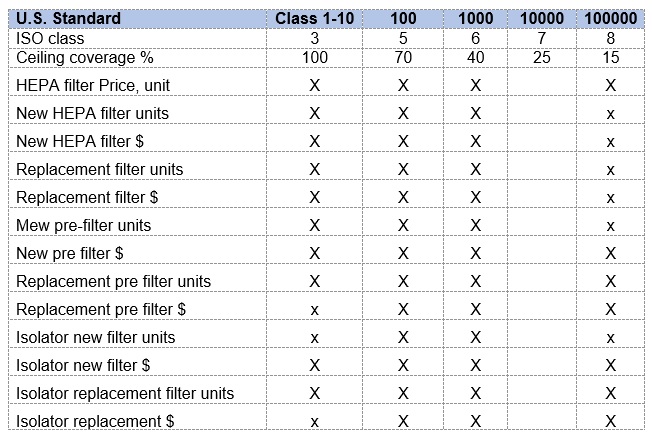
The facts and factors have been created and used to provide forecasts for cleanroom filters in every country and industry based on the cleanroom space in ft2 both for new additions and existing plants in each cleanroom class. The many facts and factors utilized in calculating space are discussed elsewhere. This analysis deals with how that data is used to generate the filter revenues and units as follows.
- The number of new HEPA filter units based on 2x4 fan filter units with 650 cfm each.
- The revenues for HEPA filter sales for new projects.
- The replacement HEPA filter units based on a 5-year life but adjusted to 4 to take into account various reasons for additional filter purchases for existing plants.
- The replacement HEPA filter revenues
- Pre-filter units sold for new projects.
- Pre-filter revenues for new projects.
- Pre-filter units sold for replacement.
- Pre-filter revenues for replacement based on MERV 7 and 6-month life.
These factors are applied to 80 countries x 5 cleanroom classifications x 11 industries x 12 years (2016-28) x 13 application/process categories resulting in 686,000 forecasts.
The cost of HEPA filters was derived as 50% of the retail price and reflects the revenue received by the HEPA filter producer.
Here is an example of the excel files starting with existing space for class 100,000 rooms. 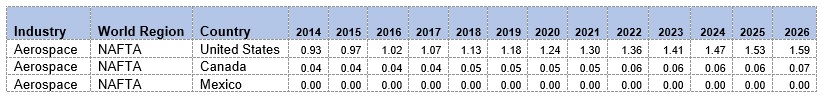
The cleanroom filter forecasts can be provided at a discount to subscribers to either the cleanroom or air filter report or can be purchased separately. For more information call Bob Mcilvaine at 847 226 2391 or This email address is being protected from spambots. You need JavaScript enabled to view it.