NEWS RELEASE March 2019
Achieving the Most Profit from Valve Sales
Management of valve companies continually analyze and predict future profitability. Unit margins have to be sufficient to exceed cost of goods sold by an amount sufficient to cover selling and administrative expense by the targeted operating margin. In 2018 Crane cost of goods sold was 64% of sales, gross profit was 36%. Income before taxes was 12%.
| Category | Crane | Flowserve | IMI | Metso Flow | ||||
| $ | % | $ | % | $ | % | $ | % | |
| Net Sales | 3345 | 100 | 3832 | 100 | 1907 | 100 | 720 | 100 |
| Cost of Sales | 2156 | 64 | 2644 | 69 | ||||
| Gross Profit | 1189 | 36 | 1187 | 31 | ||||
| Selling and General Expense | 721 | 22 | 943 | 25 | ||||
|
Income before Tax |
411 |
12 |
176 |
5 |
251 (OP} |
13 |
117 (OP) |
16 |
| Taxes | 76 | 2 | 51 | 1 | ||||
| Net Income | 335 | 10 | 119 | 3 | ||||
Flowserve COGS and selling and general expenses were higher than Crane. IMI income was 13% of sales
Metso income in their flow division was $117 million which is 16% of sales.
In 2018 the Flowserve income before taxes was 5% which is significantly lower than that of Crane. This is an example of how profitability per sales dollar can vary considerably company to company. Flowserve has a history of innovation which should result in high profit margins. The company has focused on oil and gas to a greater extent than Crane. Flowserve has suffered from the downturn in several of its key markets.
The net margins for Flowserve in the next several years should be much higher due to the expanding oil and gas market and the amount of infrastructure Flowserve has created to address it. So some of the expenses in 2018 and prior years will put Flowserve in a position to supply products with a Lower Total Cost of Ownership (LTCO) advantage.
Companies spend much more time and effort predicting various expenses than on analyzing profitable markets. Income is a direct result of profitable sales. The connection between the two needs to be quantified. This is being achieved with a new tool: Most Profitable Market (MPM).
The goal of valve companies is to maximize profits. Market forecasts should be the foundation of the business strategy. Instead they are usually treated as a peripheral tool. The reason is that market forecasts typically quantify the Total Available Market (TAM) which includes geographies and product requirements which cannot be served. The reports are customized at some expense to provide the Serviceable Obtainable Market (SOM) which reflects a market which can be served at some profit margin even if meager.
Management does not want to be chasing orders which have meager unit margins when there are opportunities with high margins. By creating the Most Profitable Market (MPM) forecast they create a very valuable foundation for the whole business program.
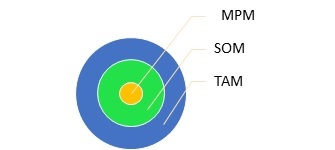
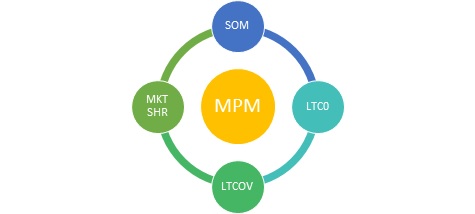
The MPM is defined as the market which yields the highest profit given the resources and knowledge available.
This market is some fraction of the SOM. The MPM can further be defined as the market where the company has the lowest total cost of ownership (LTCO) at an attractive profit margin. The MPM is further restricted to those opportunities where Lowest Total Cost of Ownership Validation (LTCOV) can be demonstrated.
The MPM is calculated based on the targeted market share. The biggest potential target in the U.S. oil and gas industry is light tight oil (LTO) extracted through hydraulic fracturing of shale. The 2018 forecast for Light Tight Oil production in 2023 by IEA was 7 million bl/d. The latest estimate by McIlvaine for light tight oil production is 15 million b/d.
| U.S. Valve Sales in the Oil and Gas Industry in 2023 | ||
|
Liquid Source |
mb/d |
SOM Valve Sales 2023 $ millions |
| LTO ( hydraulic fracturing) | 15 | 1852 |
| Gulf of Mexico | 1 | 123 |
| Natural gas liquids | 6 | 741 |
| Alaska | 0.3 | 37 |
| Other | 2 | 247 |
| Total | 24.3 | 3000 |
The $1.8 billion Light Tight Oil valve opportunity involves mostly critical and severe service applications. Cameron claims that its frac sand gate valves have three times the uptime of competitor designs. When you consider downtime, labor, and repair part costs the difference in total cost of ownership could be substantial. Prices can be raised to reflect the LTCO. Cameron has an easy route to LTCOV as a division of Schlumberger, one of the largest oil field suppliers.
Flowserve has been preparing for a big light tight oil market and the related oil and gas transport for more than a decade. In 2012 John Lenander, vice president of oil and gas valves (now President of Flow Control for Flowserve) said timing depends on the level of specialization, the amount of valves needed, and pipe size. For example, 10 valves for 200 miles of 42-inch pipe could be supplied in six to eight months. But 60 valves for 1,200 miles of 42-inch pipe would more likely be quoted with partial deliveries starting in six months, with everything completed in about a year.
“We’ve been putting a lot of additional resources into supply-chain management, project management and engineering,” he said. At the time Flowserve also was expanding plant capacity. So by identifying the MPM market but being off in timing Flowserve likely depressed profit margins over last few years but could more than compensate in the next decade.
Valve companies will want to use the MPM tool to address both the current and future market. This iterative process starts with management establishing profit goals. MPM is then established to achieve these goals based on market penetration and unit margins. This is an interactive process which involves assessment of product capabilities in comparison to competitors. It involves analysis of the MPM for individual large customers. Chevron and ExxonMobil have announced very large investments in light tight oil recently. The valve company has to assess its ability to achieve LTCOV for its products with each of the major oil companies. This requires input from the sales people dealing with these companies. It also involves detailed process knowledge. With the completion of iterative process the MPM becomes the foundation of the company business program.
N028 Industrial Valves: World Market provides the Total Available Market. MPM will be derived from TAM. This report has details by valve type, industry and country. It also has TAM forecasts for the largest 200 purchasers. This detailed TAM information can be then used to construct the MPM. MciIvaine can work with valve suppliers to help them create the optimum MPM using the TAM information in the valve report but also the TAM information appearing in industry market reports such as N049 Oil, Gas, Shale and Refining Markets and Projects, Hydraulic Fracturing MPM, N6F World Cleanroom Markets, N027 FGD Market and Strategies and other market reports listed at http://home.mcilvainecompany.com/index.php/markets
The MPM for individual prospects can be created with use of N032 Industrial Plants and Projects, 62EI North American Municipal Wastewater Treatment Facilities and People Database, 67EI North American Public Water Plants and People, 42EI Utility Tracking System, 31I Renewable Energy Update and Projects, 80A World Cleanroom Projects, 59EI Gas Turbine and Reciprocating Engine Supplier Program, and 44I Coal Fired Power Plant Decisions
For more information on MPM contact Bob McIlvaine at This email address is being protected from spambots. You need JavaScript enabled to view it. or call him at 847 226 2391.